Visualisation (‘stixpy.visualisation’)#
The visualisation submodule contain classes and function related to the visualisations.
stixpy.visualisation Package#
stixpy.visualisation.map_reprojection Module#
Examples
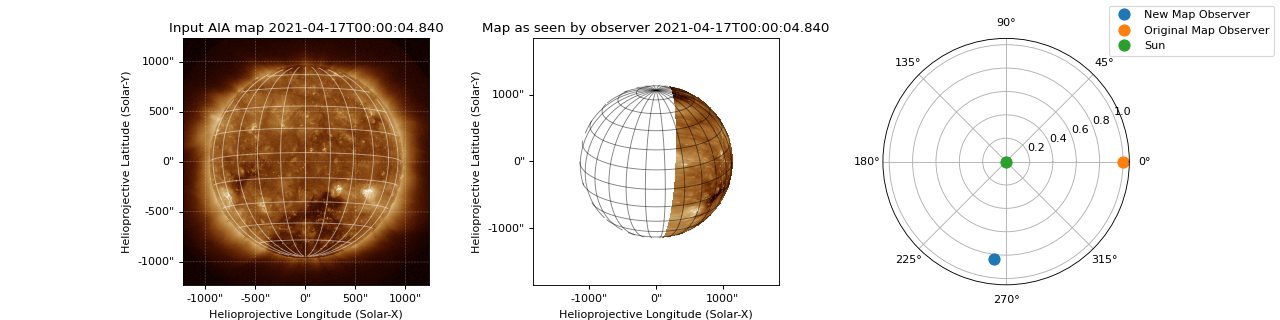
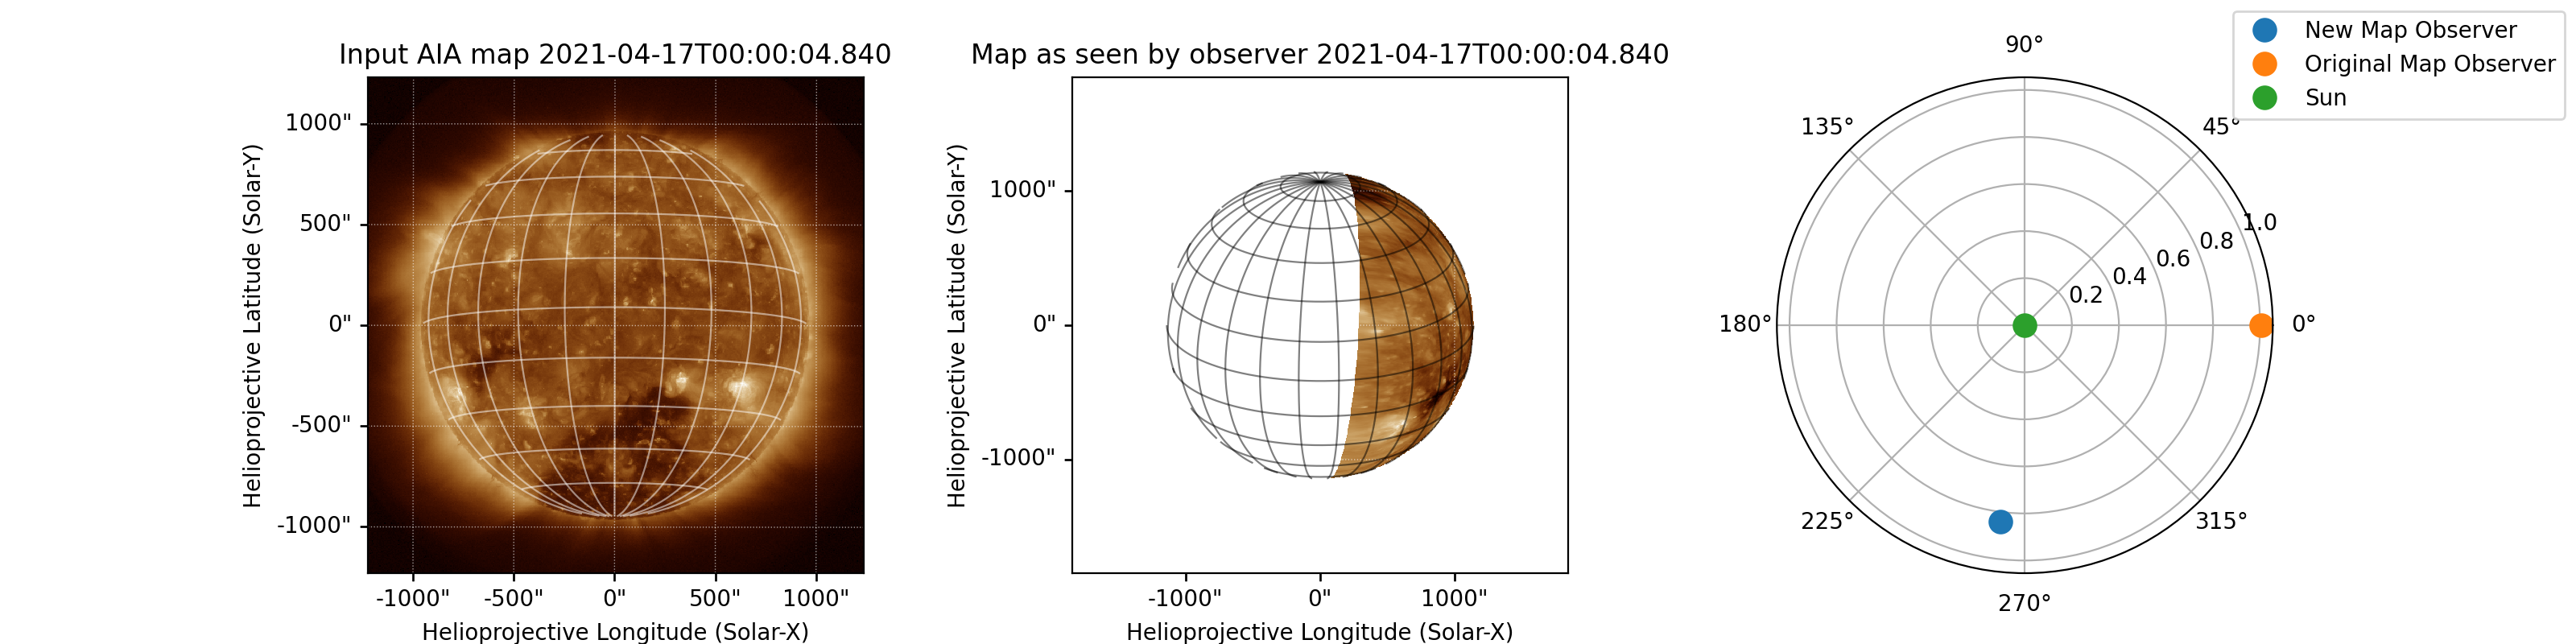
An AIA map
import astropy.units as u
from astropy.coordinates import SkyCoord
from sunpy.net import Fido, attrs as a
from sunpy.map import Map
from sunpy.coordinates.frames import HeliographicStonyhurst
from stixpy.visualisation.map_reprojection import reproject_map, plot_map_reproj, get_solo_position

# Search and download map using FIDO
aia = (a.Instrument.aia &
    a.Sample(24 * u.hour) &
    a.Time('2021-04-17', '2021-04-18'))
wave = a.Wavelength(19.3 * u.nm, 19.3 * u.nm)
query = Fido.search(wave, aia)
results = Fido.fetch(query[0][0])

# Create map and resample to speed up calculations
map = Map(results)
map = map.resample([512, 512]*u.pix)

# Get SOLO position observer
# observer = get_solo_position(map) # broken on RTD
observer = SkyCoord(-97.01771373*u.deg, 21.20931737*u.deg, 1.25689226e+08*u.km,
                    frame=HeliographicStonyhurst, obstime='2021-04-17 00:00:04.840000')

# Reproject Map
reprojected_map = reproject_map(map, observer, out_shape=(768, 768))

# Run plotting function
plot_map_reproj(map, reprojected_map)
(Source code, png, hires.png, pdf)

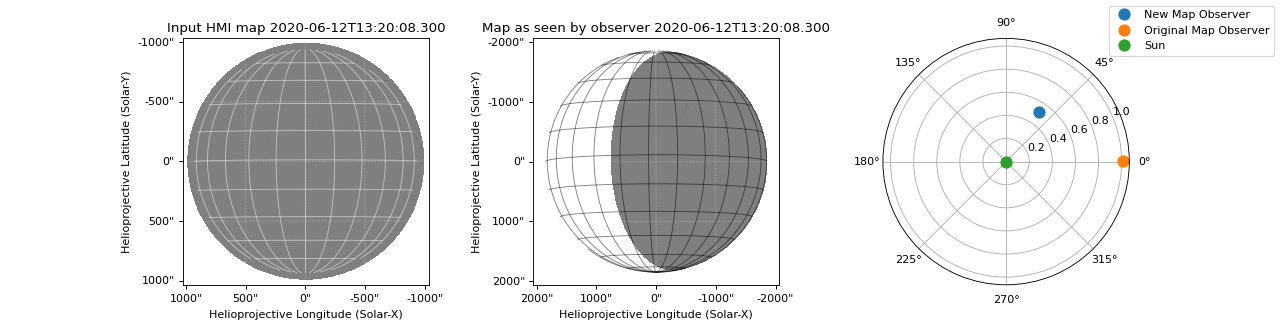
A HMI map
import astropy.units as u
from astropy.coordinates import SkyCoord
from sunpy.net import Fido, attrs as a
from sunpy.map import Map
from sunpy.coordinates.frames import HeliographicStonyhurst
from stixpy.visualisation.map_reprojection import reproject_map, plot_map_reproj, get_solo_position

# Search and download map using FIDO
query = Fido.search(a.Time('2020/06/12 13:20:00', '2020/06/12 13:40:00'),
                    a.Instrument.hmi, a.Physobs.los_magnetic_field)
result = Fido.fetch(query[0][0])

# Create map and resample to speed up calculations
map = Map(result)
map = map.resample([512, 512] * u.pix)

# Set SOLO as observer
# observer = get_solo_position(map) # broke on RTD
observer = SkyCoord(56.18727061*u.deg, 3.5358653*u.deg, 77369481.8542484*u.km,
                    frame=HeliographicStonyhurst, obstime='2020-06-12 13:20:08.300000')

# Reproject Map
reprojected_map = reproject_map(map, observer, out_shape=(1024, 1024))

# Run plotting function
plot_map_reproj(map, reprojected_map)
(Source code, png, hires.png, pdf)

Functions#
|
Return the position of SOLO at the time the map was observed |
|
Reproject a map as viewed from a different observer. |
|
Generates MetaDict and WCS headers for reprojected map |
|
Plot the original map, reprojected map and observer locations |